Luci Widgets: Interactive Transaction Intelligence
Lucinity’s Customer 360 just got a powerful upgrade. With new Agentic AI-powered Luci Widgets, compliance teams can visualize transactions, detect anomalies, and drill into details in real time — transforming fragmented data into clear, actionable intelligence for faster investigations.
Lucinity’s Customer 360 has always helped make sense of fragmented data by bringing it into a single, unified profile. Now, with the addition of Agentic AI-powered Luci Widgets, it evolves into a true operational engine for financial crime investigations.
Luci AI acts as a data scientist embedded inside every investigation.
These widgets transform raw transaction data into clear, interactive visuals and summaries — delivering real-time, explainable insights directly into the Customer 360 view. They help compliance teams explore behavior, spot anomalies, and make faster, more confident decisions without switching between systems.
What Luci Widgets Deliver
Luci’s widgets are built specifically to reduce investigation time and provide sharper context. They allow users to filter, visualize, and analyze recent transactions in context. Each widget supports configurable timeframes and direct interaction. You can click through visual elements to reach filtered transaction lists instantly, allowing deeper investigation without additional work.
Instead of going through a complex spreadsheet or static reports, compliance teams can now use Luci Widgets to:
- Examine the movement of funds to and from the actor
- Understand transaction characteristics across methods, currencies, and countries
- Investigate anomalies such as behavioral shifts, unusual counterparties, or irregular volumes
- Filter and segment data with one click
- Drill down directly to transaction-level details from high-level visuals
The Five Luci Widgets and What They Do
Each widget addresses a specific investigative need, helping teams cut through volumes of transaction data. Let's see how each one works, why it's useful, and what you can use it for.
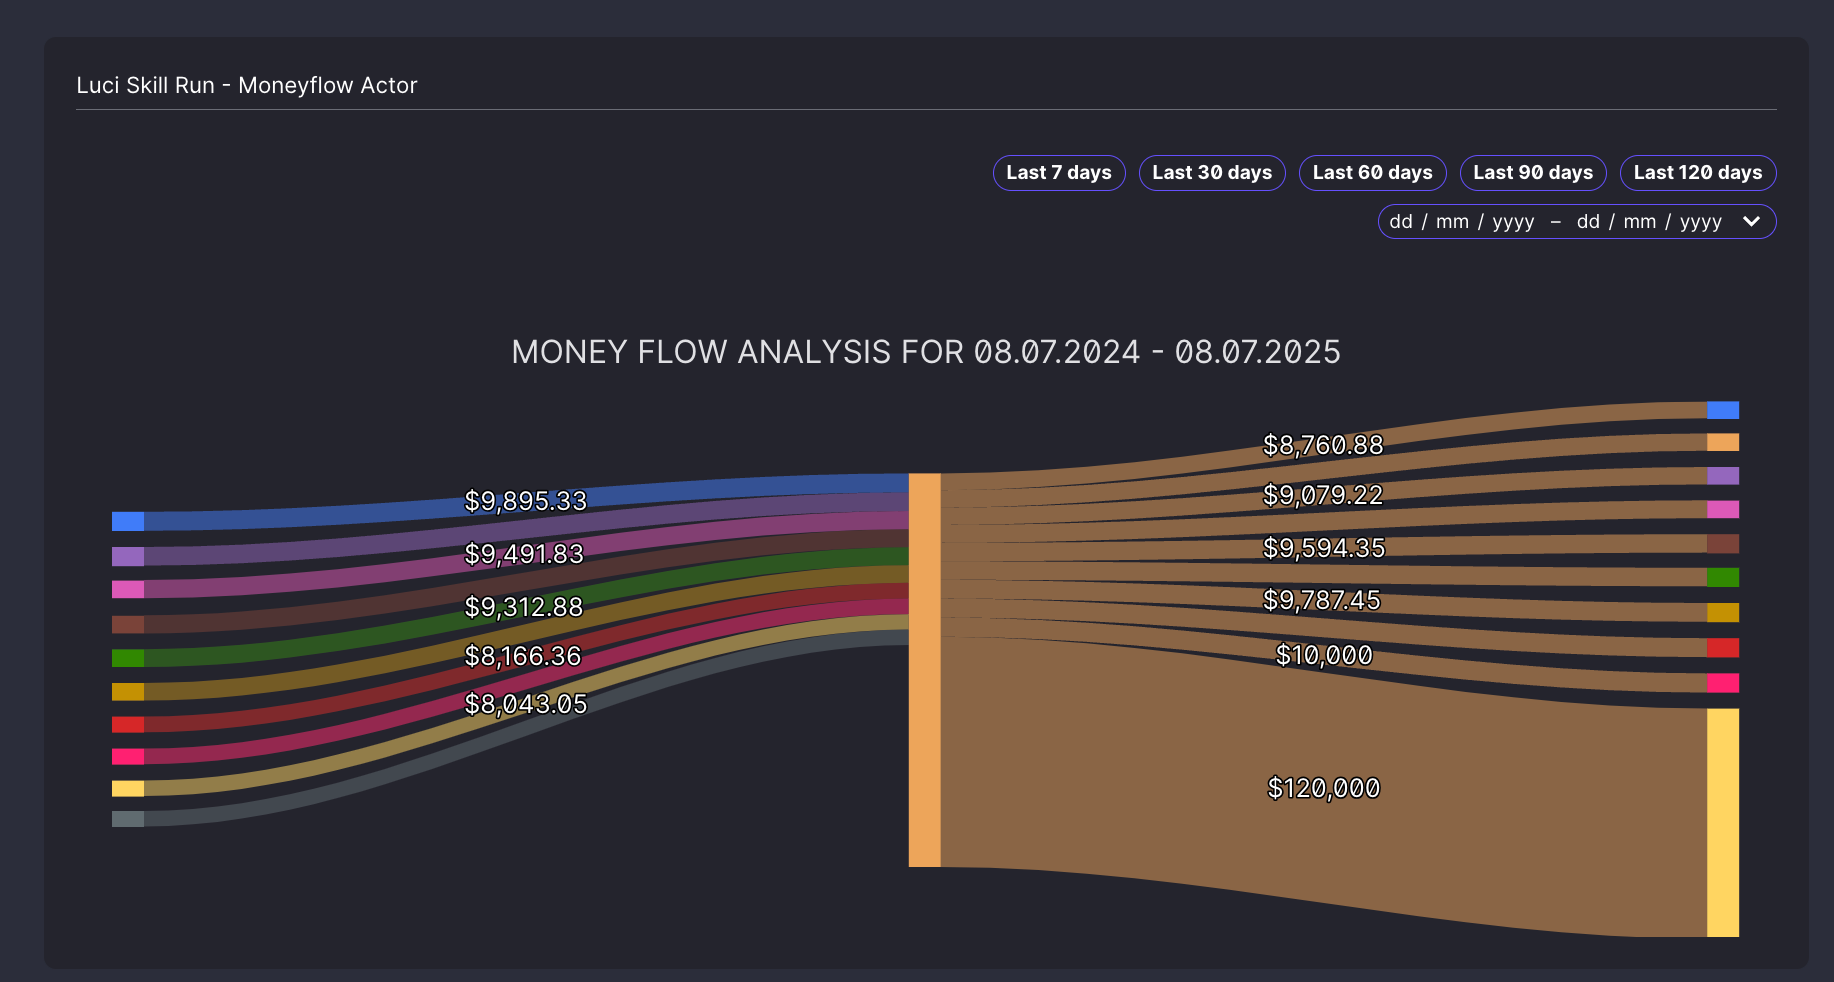
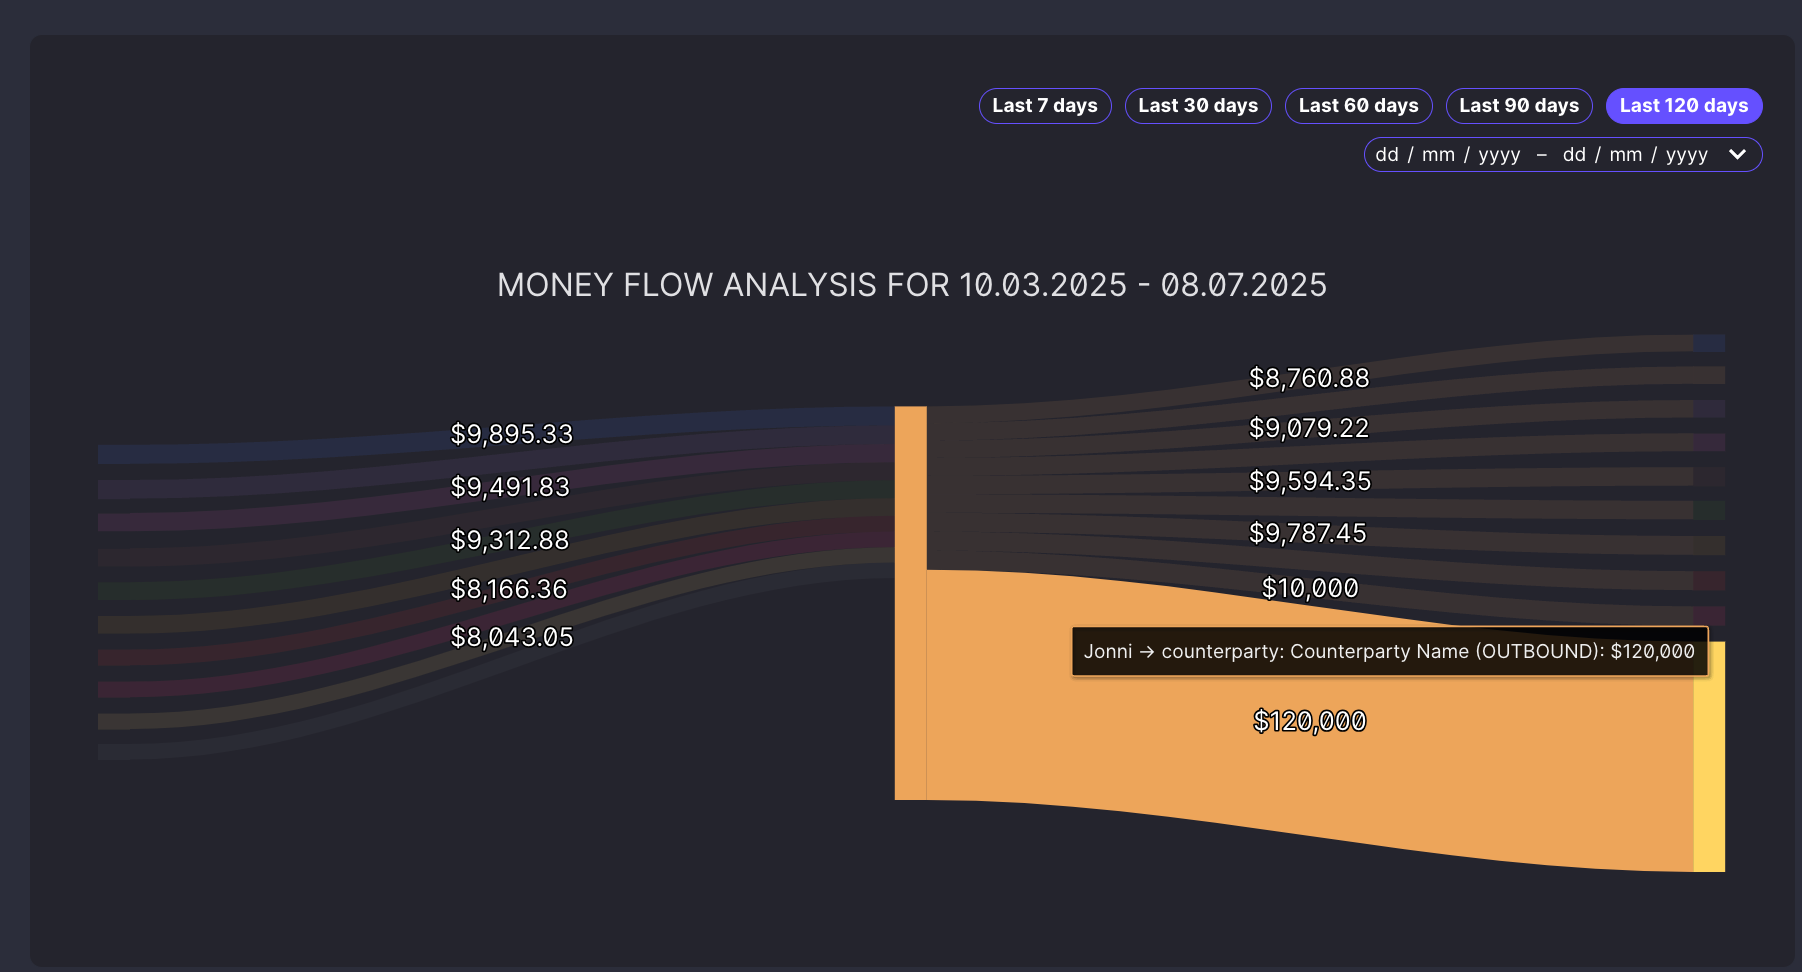
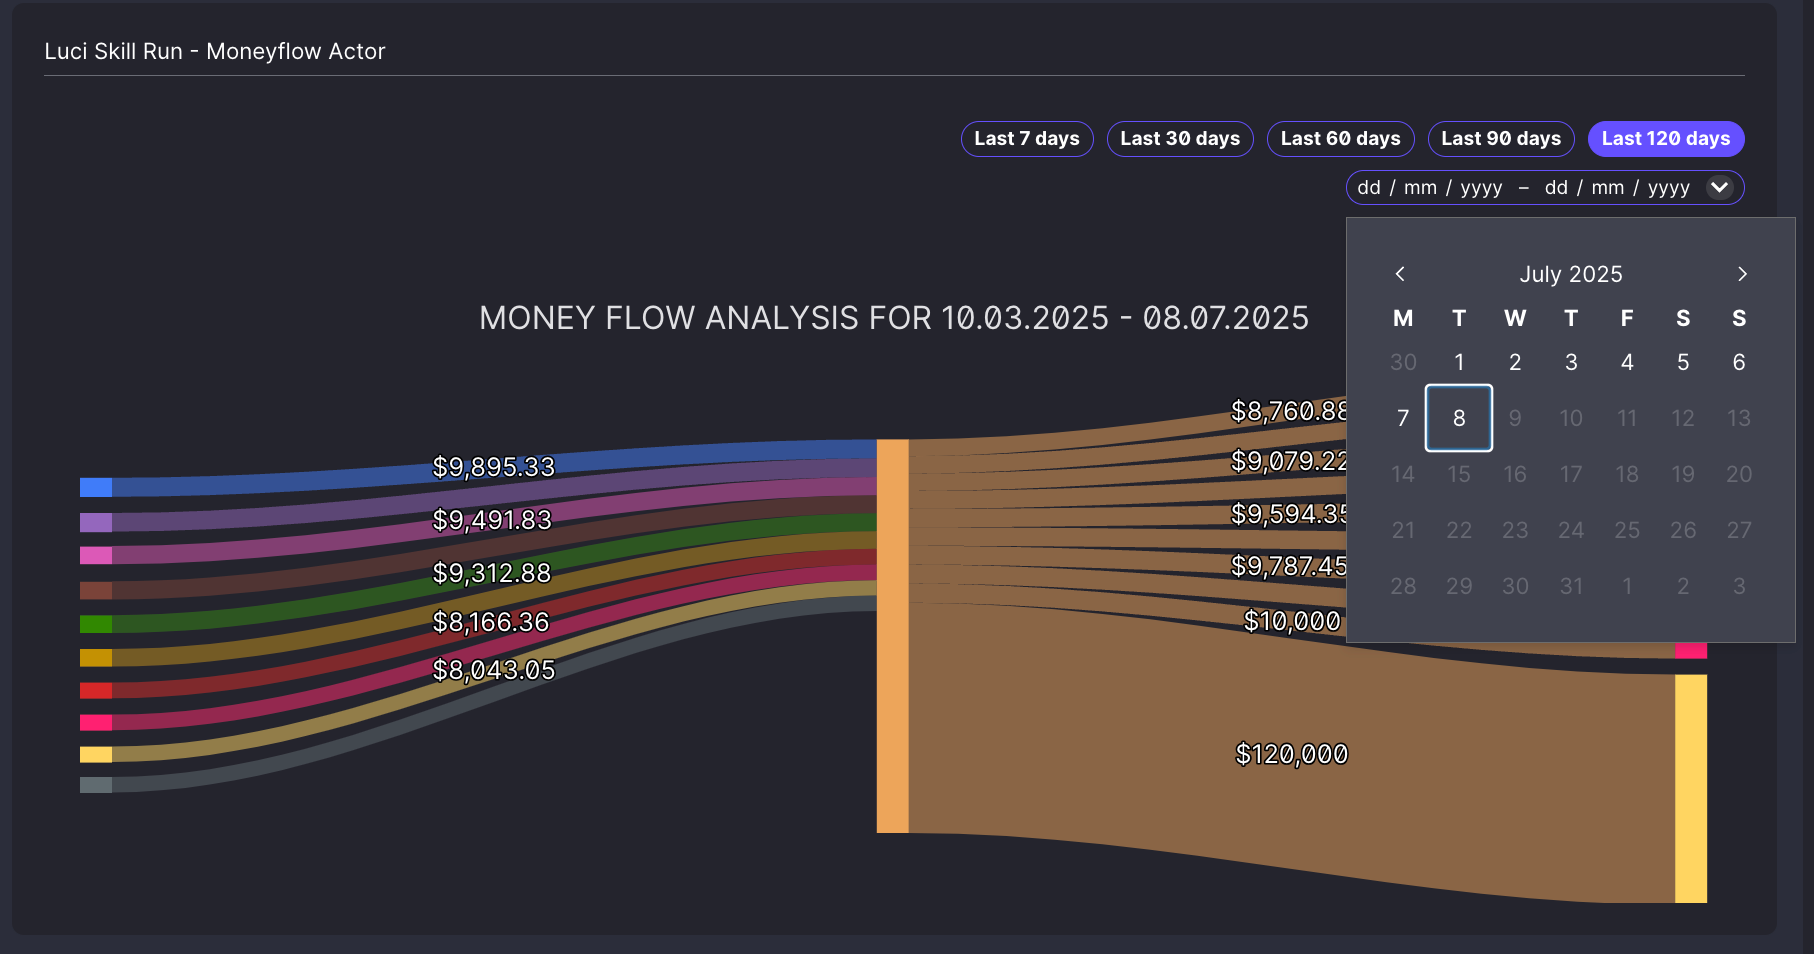
1. Money Flow Widget (Sankey Diagram)
Have you ever tried to trace where funds are coming from or going, only to get lost in spreadsheets? The Money Flow Widget replaces that friction with a clean, interactive diagram showing how money moves to and from the actor.
The actor sits at the center, and every leg in the diagram represents a fund flow relationship. Arrow width shows transaction value, and you can hover to see counterparty names and totals. Click a leg to instantly access the filtered transactions.
Why does it matter?
You can now identify layering, concentration points, or suspicious transaction loops in seconds. It turns fund tracing into something fast and visual, not manual and error-prone.
What can you use it for?
- Mapping complex layering or circular flows
- Pinpointing counterparties involved in high-value transfers
- Prioritizing cases with unusual directional fund activity

2. Transaction Summary Widget
Do you want to know where, how, and with whom someone is transacting without building your own pivot table? This widget organizes everything to help you, highlighting the top five counterparties for both incoming and outgoing transactions. It also breaks down activity by method, country, and currency. All data is ranked by transaction value within the selected timeframe.
Why does it matter?
You immediately see whether the actor’s transaction behavior aligns with their expected profile. It surfaces red flags quickly and provides clear context for next steps.
What can you use it for?
- Understanding an actor’s primary relationships and channels
- Spotting jurisdictional or currency mismatches
- Building a case narrative backed by structured summaries
3. Transaction Comparison Widget
Behavior doesn’t usually change without a reason, so you need to know when it does. That’s why this widget shows month-over-month changes in an actor’s transaction behavior. You can group the data by method, currency, or country, and the widget highlights percentage increases or decreases over time.
Why does it matter?
It helps you spot when something changes. A spike, drop, or shift in behavior could mean something important—like a customer pulling back or trying something new.
What can you use it for?
- Finding behavioral red flags early
- Validating consistent transaction trends
- Prioritizing actors with abrupt or irregular patterns
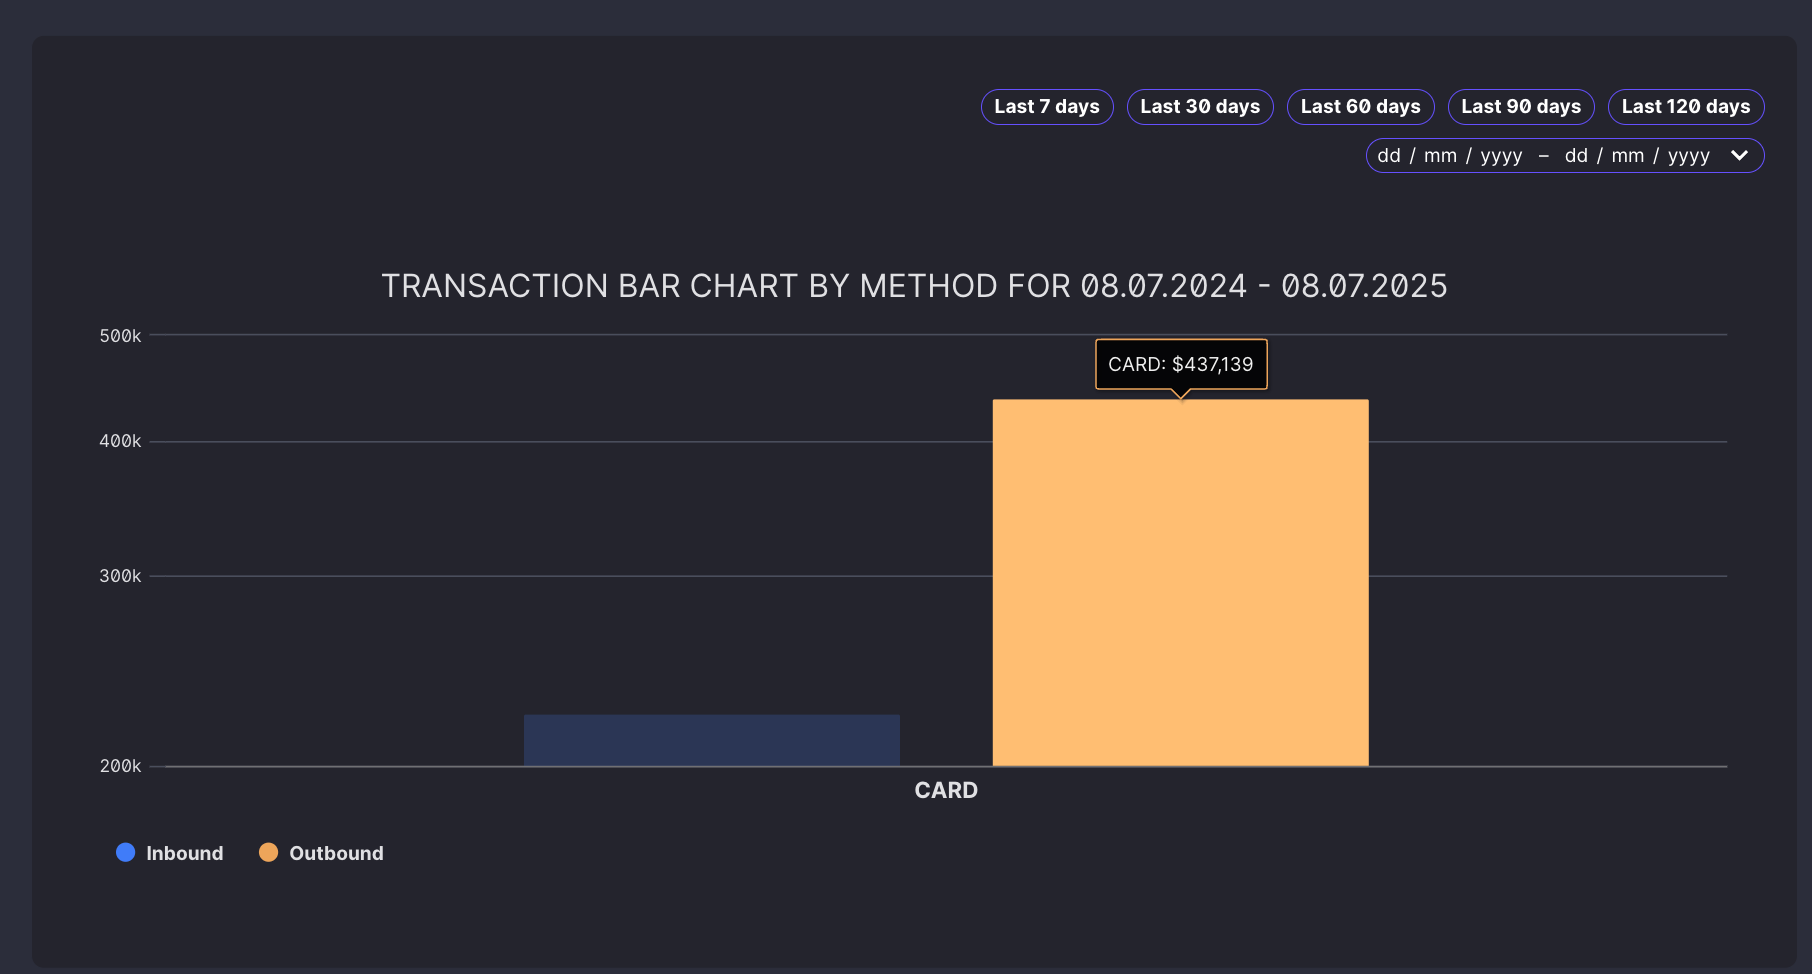
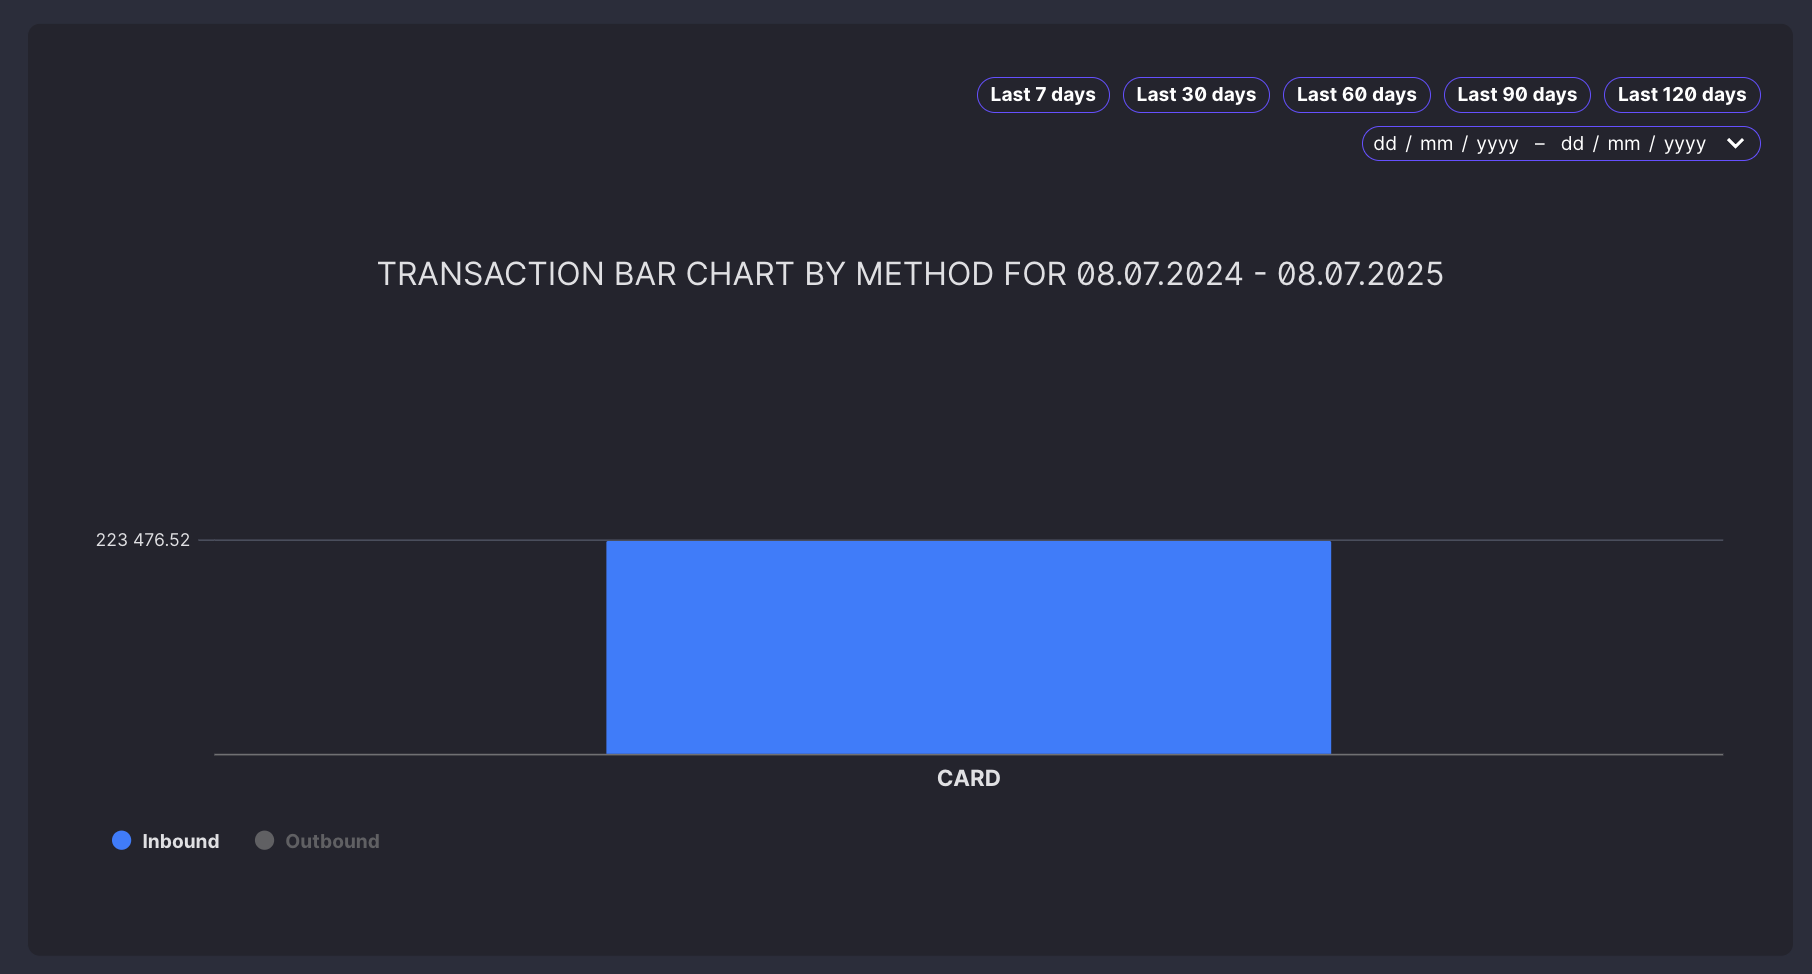
4. Interactive Bar Chart Widget
Do you need a quick view of how transaction activity is split? This widget gives you an instant visual breakdown. By default, it splits inbound and outbound activity by transaction method. You can configure it to focus on currency, country, or other attributes. Each bar shows either transaction count or value. Clicking on a bar filters the associated transactions for a more detailed review.
Why does it matter?
It’s an efficient way to compare and contrast segments of an actor’s activity without running manual filters or reports. One glance gives you insight.
What can you use it for?
- Comparing usage across payment methods
- Checking the balance between inbound and outbound flows
- Filtering quickly into a dominant activity segment
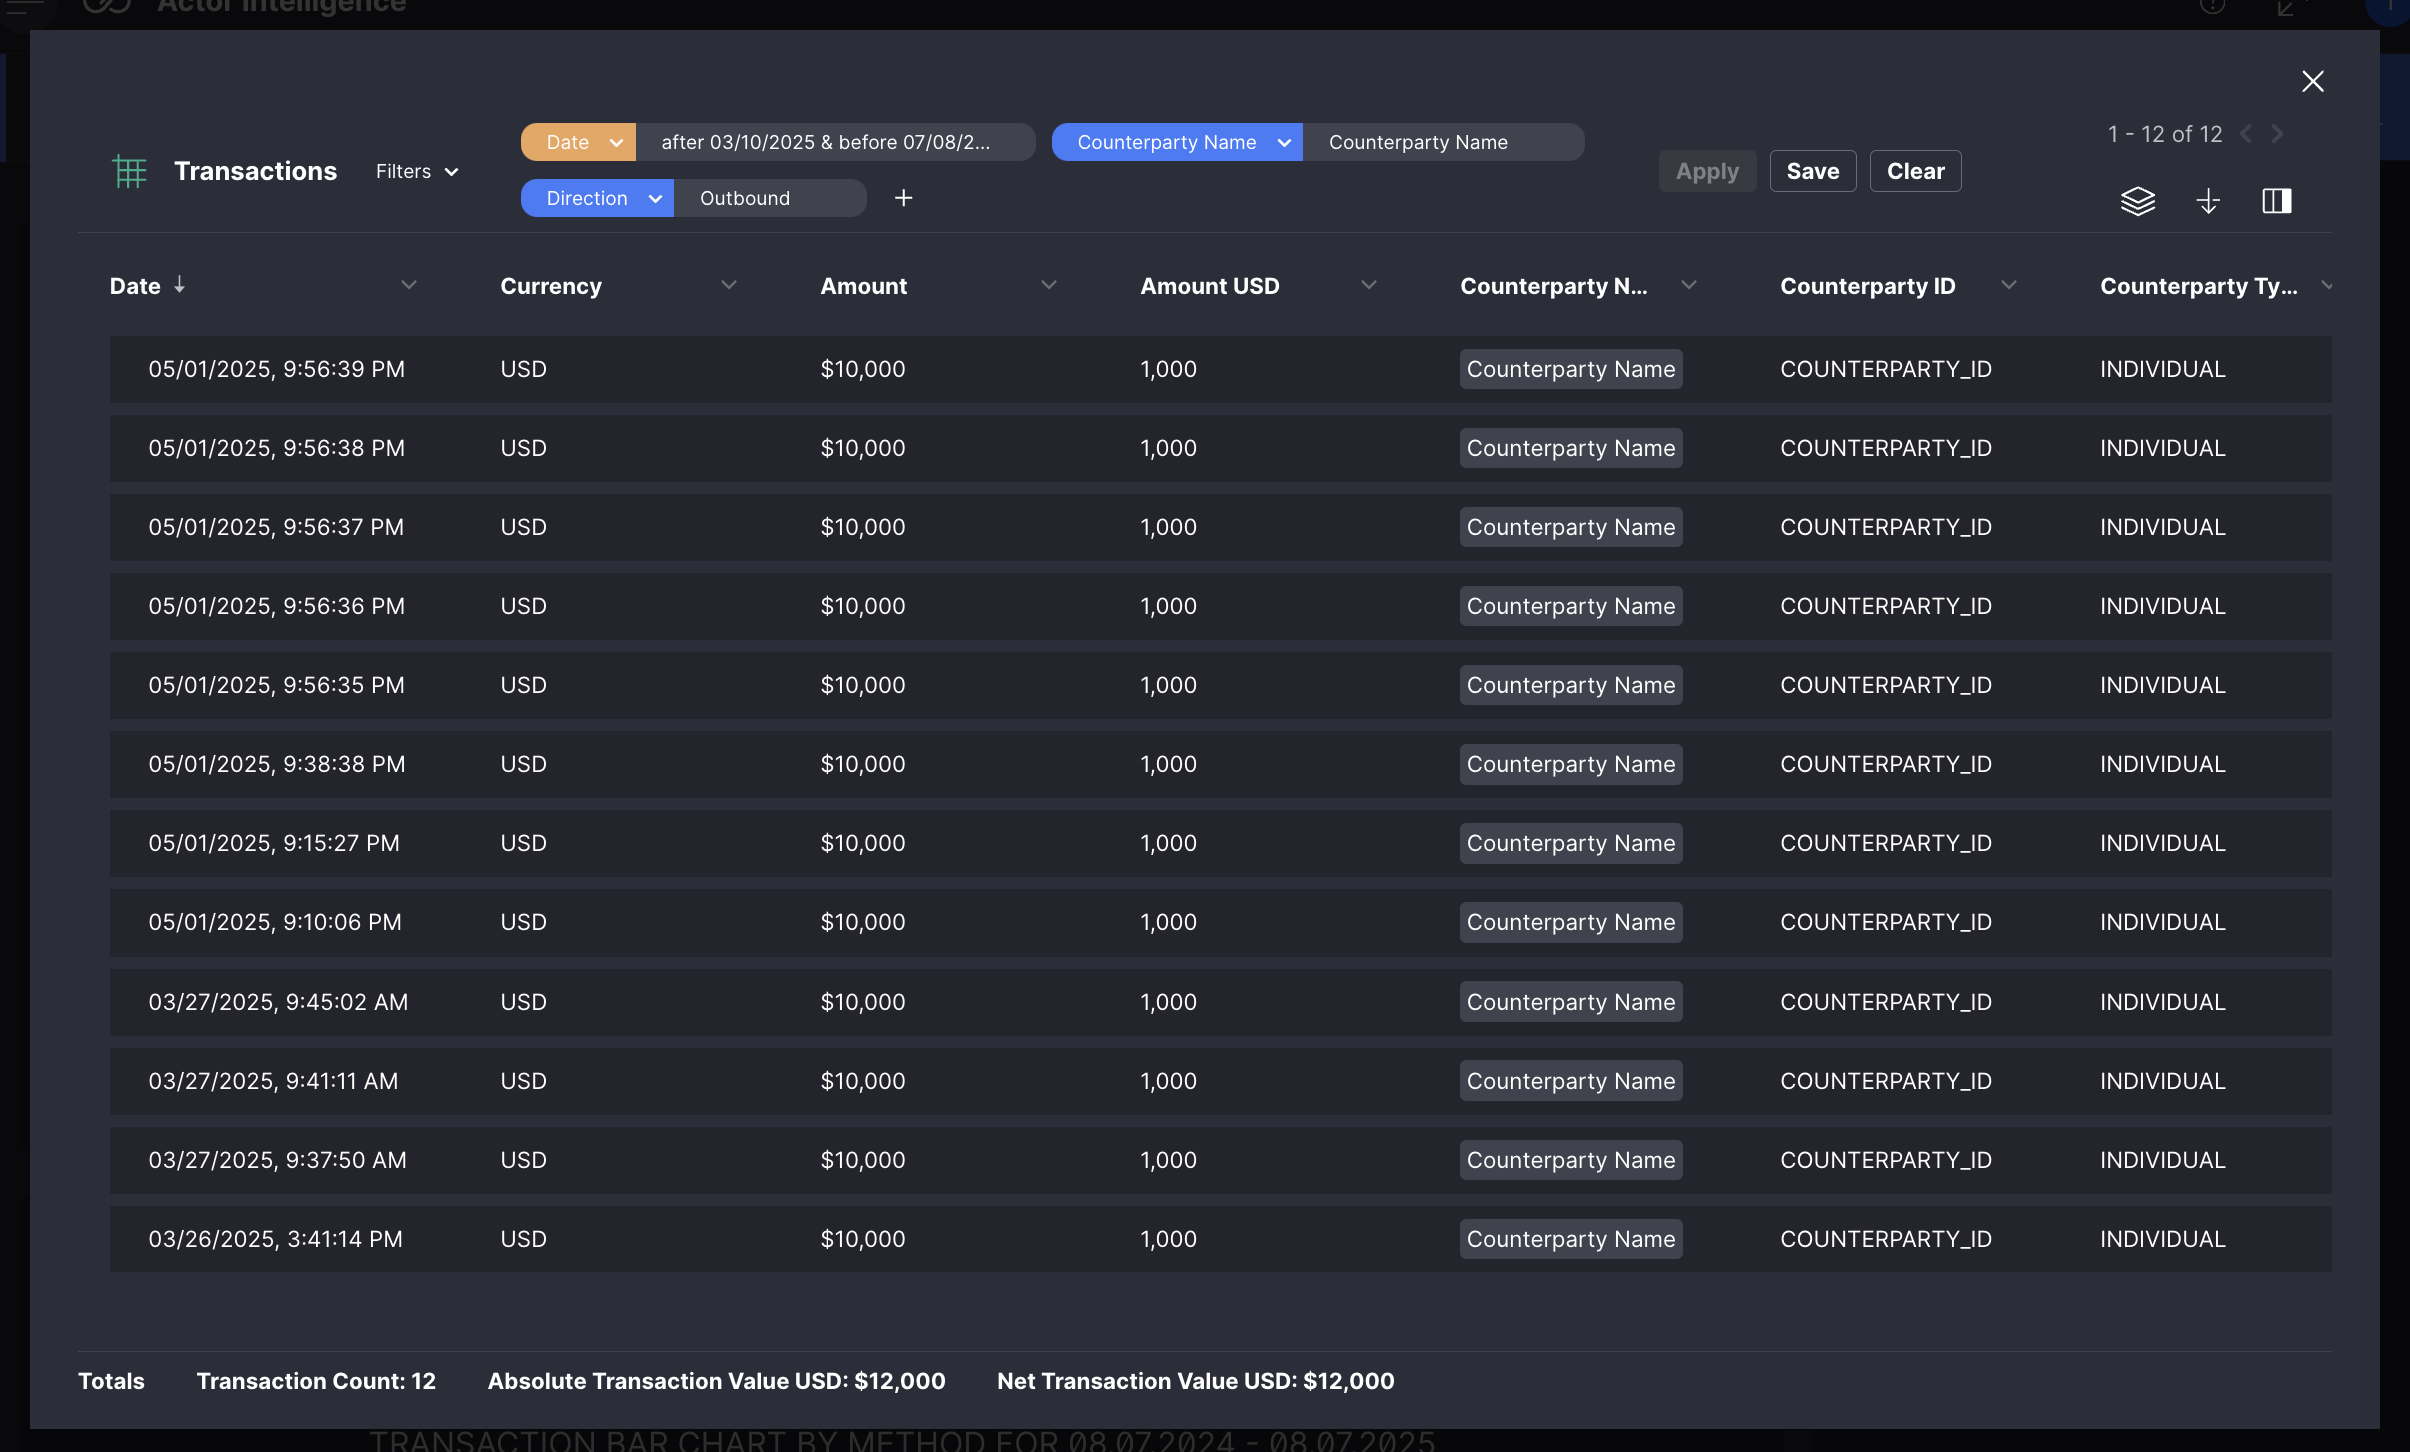
5. Interactive Transaction Modal
When you click on a widget or chart, this is where you land. The modal opens with the classic transaction layout and automatically applies the right filters based on what you clicked. It gives you a filtered view of the exact transactions behind the visual, so you can drill down from high-level trends to detailed data without losing context.
Why does it matter?
It turns insights into action. Instead of starting over, you jump straight from a chart to the exact transactions you need to review—fast, focused, and in context.
What can you use it for?
- Reviewing supporting data immediately
- Extracting evidence for alerts, RFIs, or SARs
- Building detailed, audit-ready case notes
Configurability That Works for You
Every widget supports quick filtering by standard timeframes (7, 30, 60, 90, or 120 days) or by setting a custom range using the date picker. If an actor has more than 10,000 transactions, only the most recent 10,000 are analyzed, and the system clearly indicates the range used.
You can also configure how information is grouped. For example, in the Transaction Comparison and Bar Chart widgets, data can be grouped by transaction method, currency, location, or left ungrouped for aggregate views. The Bar Chart widget further allows users to focus specifically on inbound or outbound activity by clicking elements in the legend.
Finally, your admin or Customer Success Manager can customize which widgets are visible in your environment. This ensures the interface reflects your actual workflows - whether that means prioritizing counterparties, surfacing high-risk jurisdictions, or tailoring visuals to specific use cases.
Luci Widgets in Customer 360 are designed to support real FinCrime investigations by replacing manual analysis and fragmented tools with immediate, useful insights.
To see how Lucinity can help you cut review time and bring more context to your investigations, book a demo with our team.